Home > Rides > The Ride Page > Ride Graph
Ride Graph
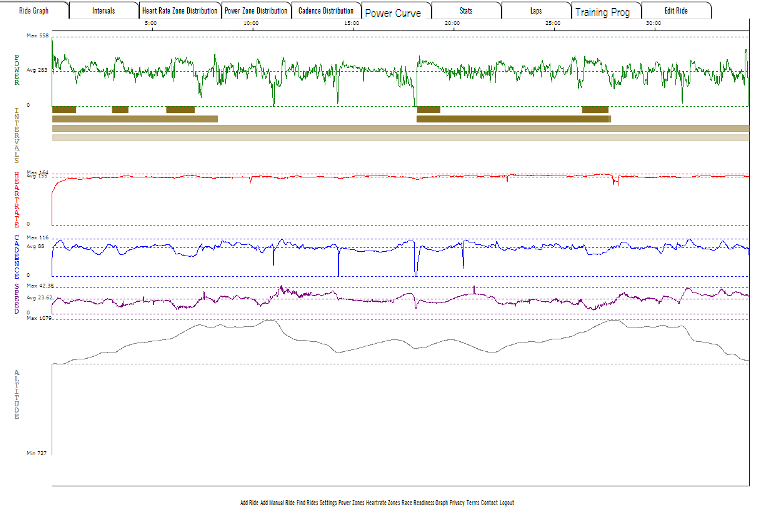
The Ride Graph display a ride's data interactively, with the timeline as the X axis. The graph displays Power, Intervals, Speed, and Altitude. If you've recorded Heart Rate and Cadence it will display those as well. Intervals are displayed in Zone order top to bottom. Hovering over an interval with your mouse will display a "tool tip" for that interval.
- Hovering over a point on the graph will display that point's data, (Time, Watts, Heartrate, Cadence, Speed, Distance, Altitude) on the graph's floating Info Box.
- Clicking on a point on the graph will start a selection. Moving the mouse from left to right increases the distance/time for the selection. The Info Box displays selection Time, Average Watts, Average Heartrate, Average Cadence, Average Speed, and Ascent for the selection. Moving the mouse from right to left decreases the selection. Clicking again ends the selection, as does moving the mouse from right to left past the selection's starting point.
- Clicking on an Interval drops a marker on the map at the start of the Interval, and outlines the Interval in blue on the map. Clicking on the marker displays an Info Box which contains Interval information. Clicking on an Interval already in a displayed state hides the Interval and the marker.

See also